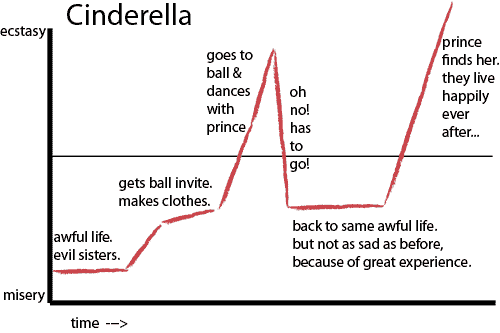
How can graphs and charts help you with your writing? Blogger Derek Sivers shares these story grids from Kurt Vonnegut to help you visualize the plot of your story. (via.) Here’s one of the story of Cinderella:

And if nothing else, a graph might put things in perspective. Witness blogger Ed Yong’s graph of what the writing process feels like (via). He’s a science writer, but this could apply just as well to fiction writing:

My favorite point, and one I’ve been at all too often: “Regurgitated a plate of idea spaghetti. I’ll never extract a single strand from this. Maybe pissing about on the internet will help.”
And for the truly hardcore, there’s the Periodic Table of Storytelling, which allows you to combine various tropes (from TV Tropes)—like “Chekhov’s gun” and “Redepmtion quest” and “Moral dissonance” to summarize plots. For example, Star Wars combines conflict, the empire, “The dragon,” “The Chosen One,” and “You have failed me.”


